
Every filing
Every bank. Every credit union.
Call Reports back to 1984 and NCUA 5300 back to 1994, normalized across form changes so a trend line means the same thing in every quarter.
Bank & credit union intelligence
Call Report and NCUA 5300 data for every U.S. bank and credit union, benchmarked against the peers you choose, from one quarter to forty years.
For banks, credit unions, and the teams who advise them.
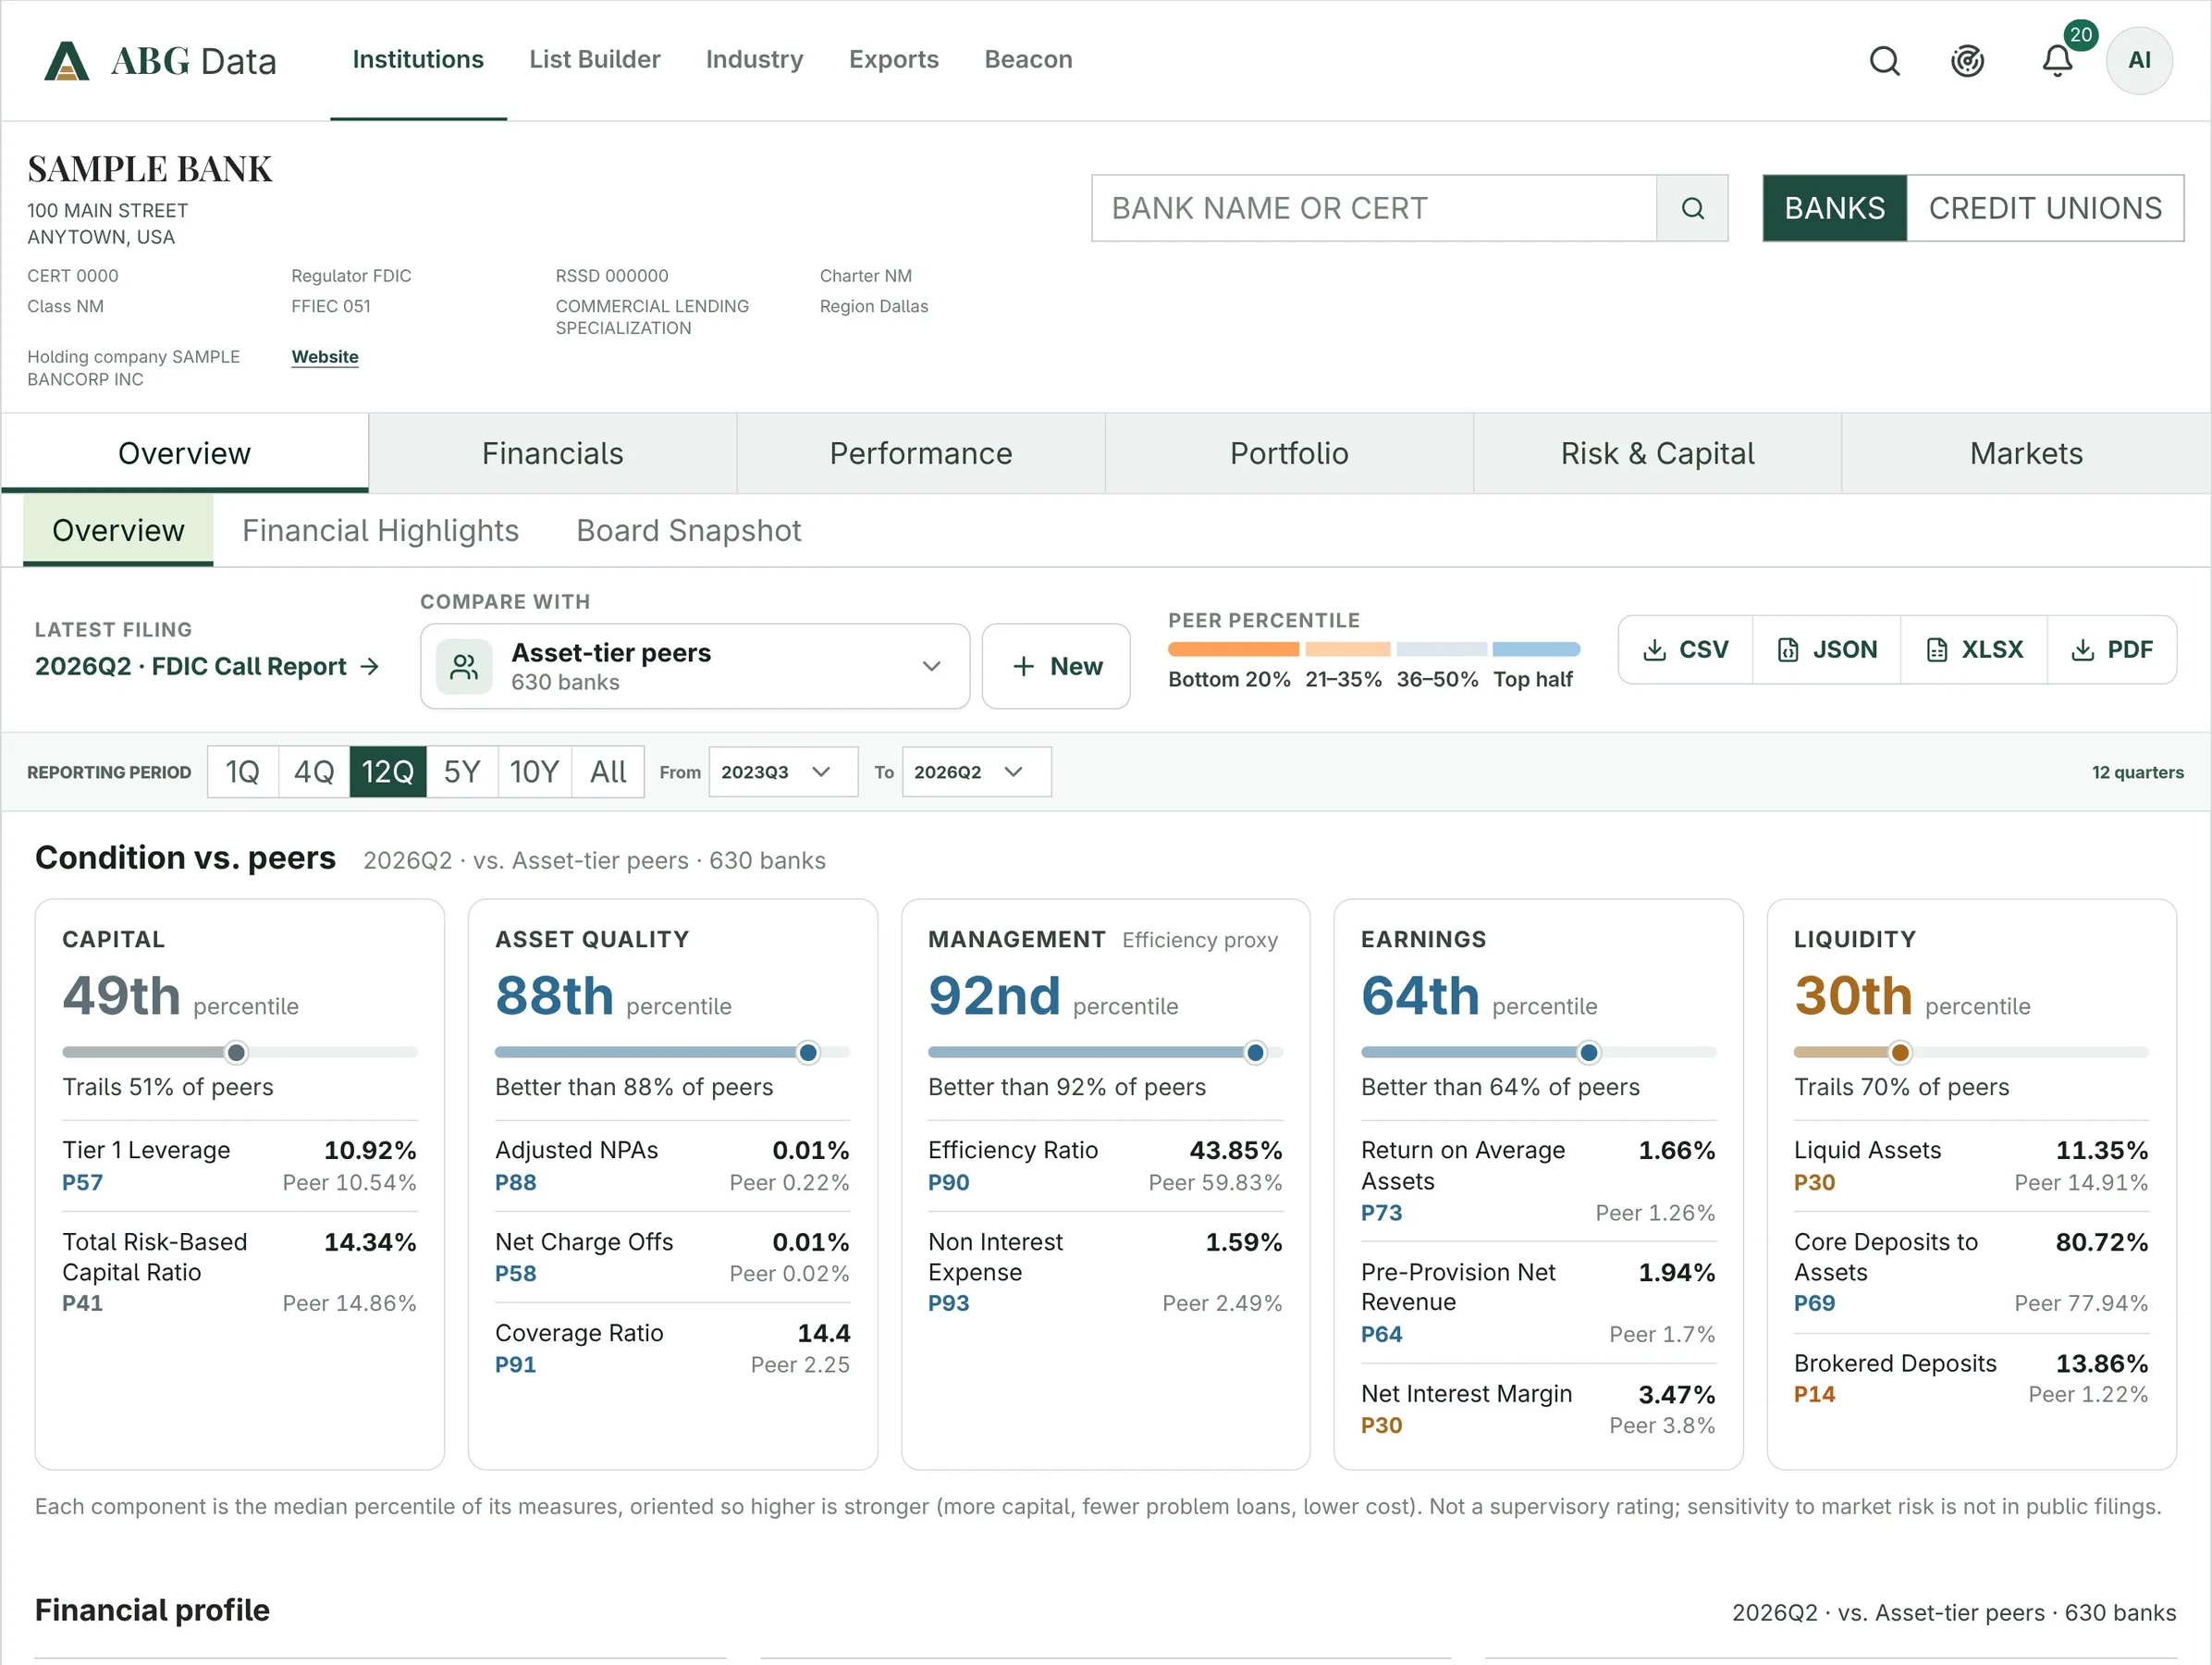
One place for the whole picture
Every filing
Call Reports back to 1984 and NCUA 5300 back to 1994, normalized across form changes so a trend line means the same thing in every quarter.
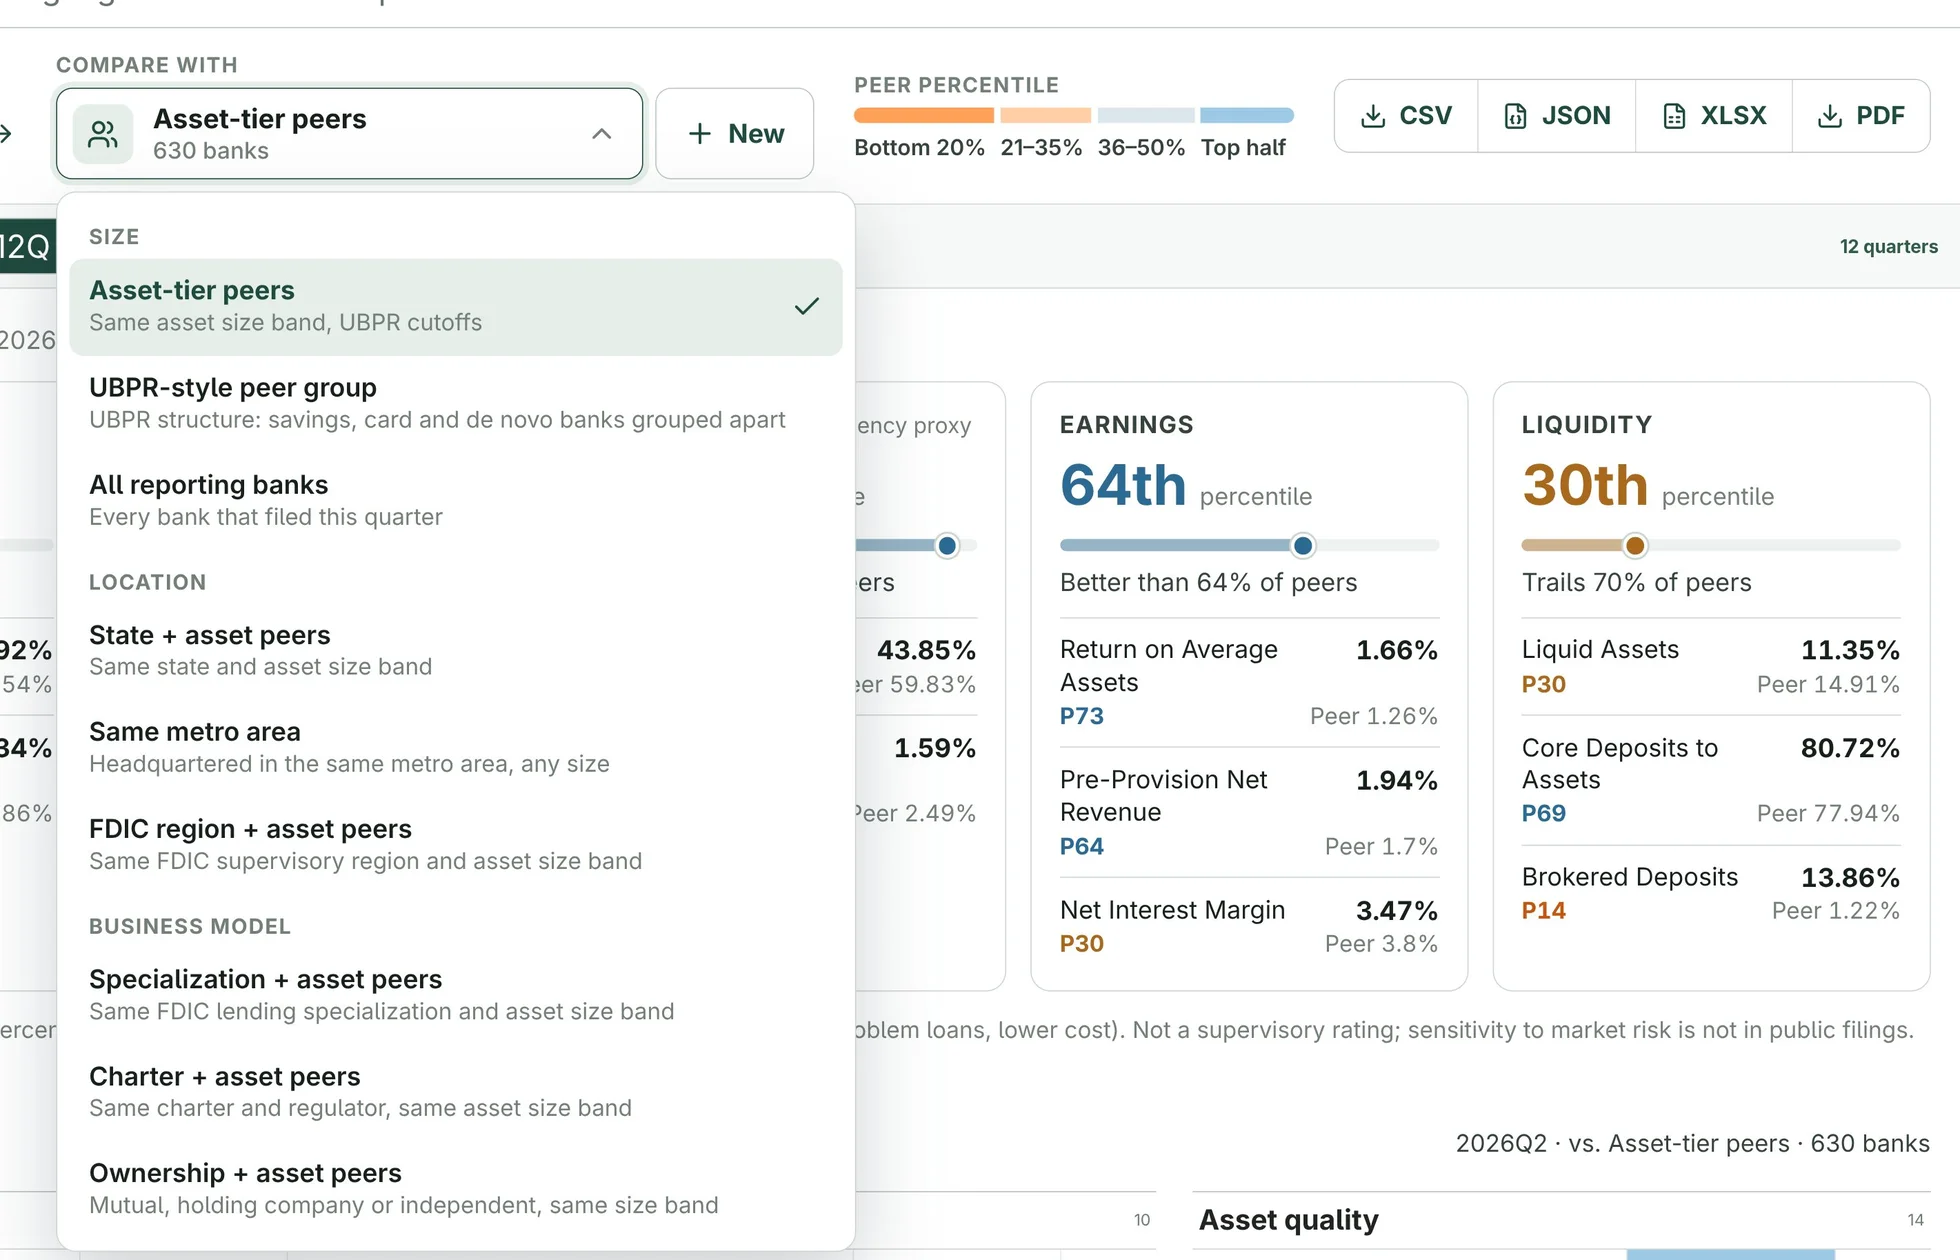
Any peer group
Nine standard bank groups and seven credit union groups, plus peer groups your team builds by size, market, charter, and ownership.
Answers
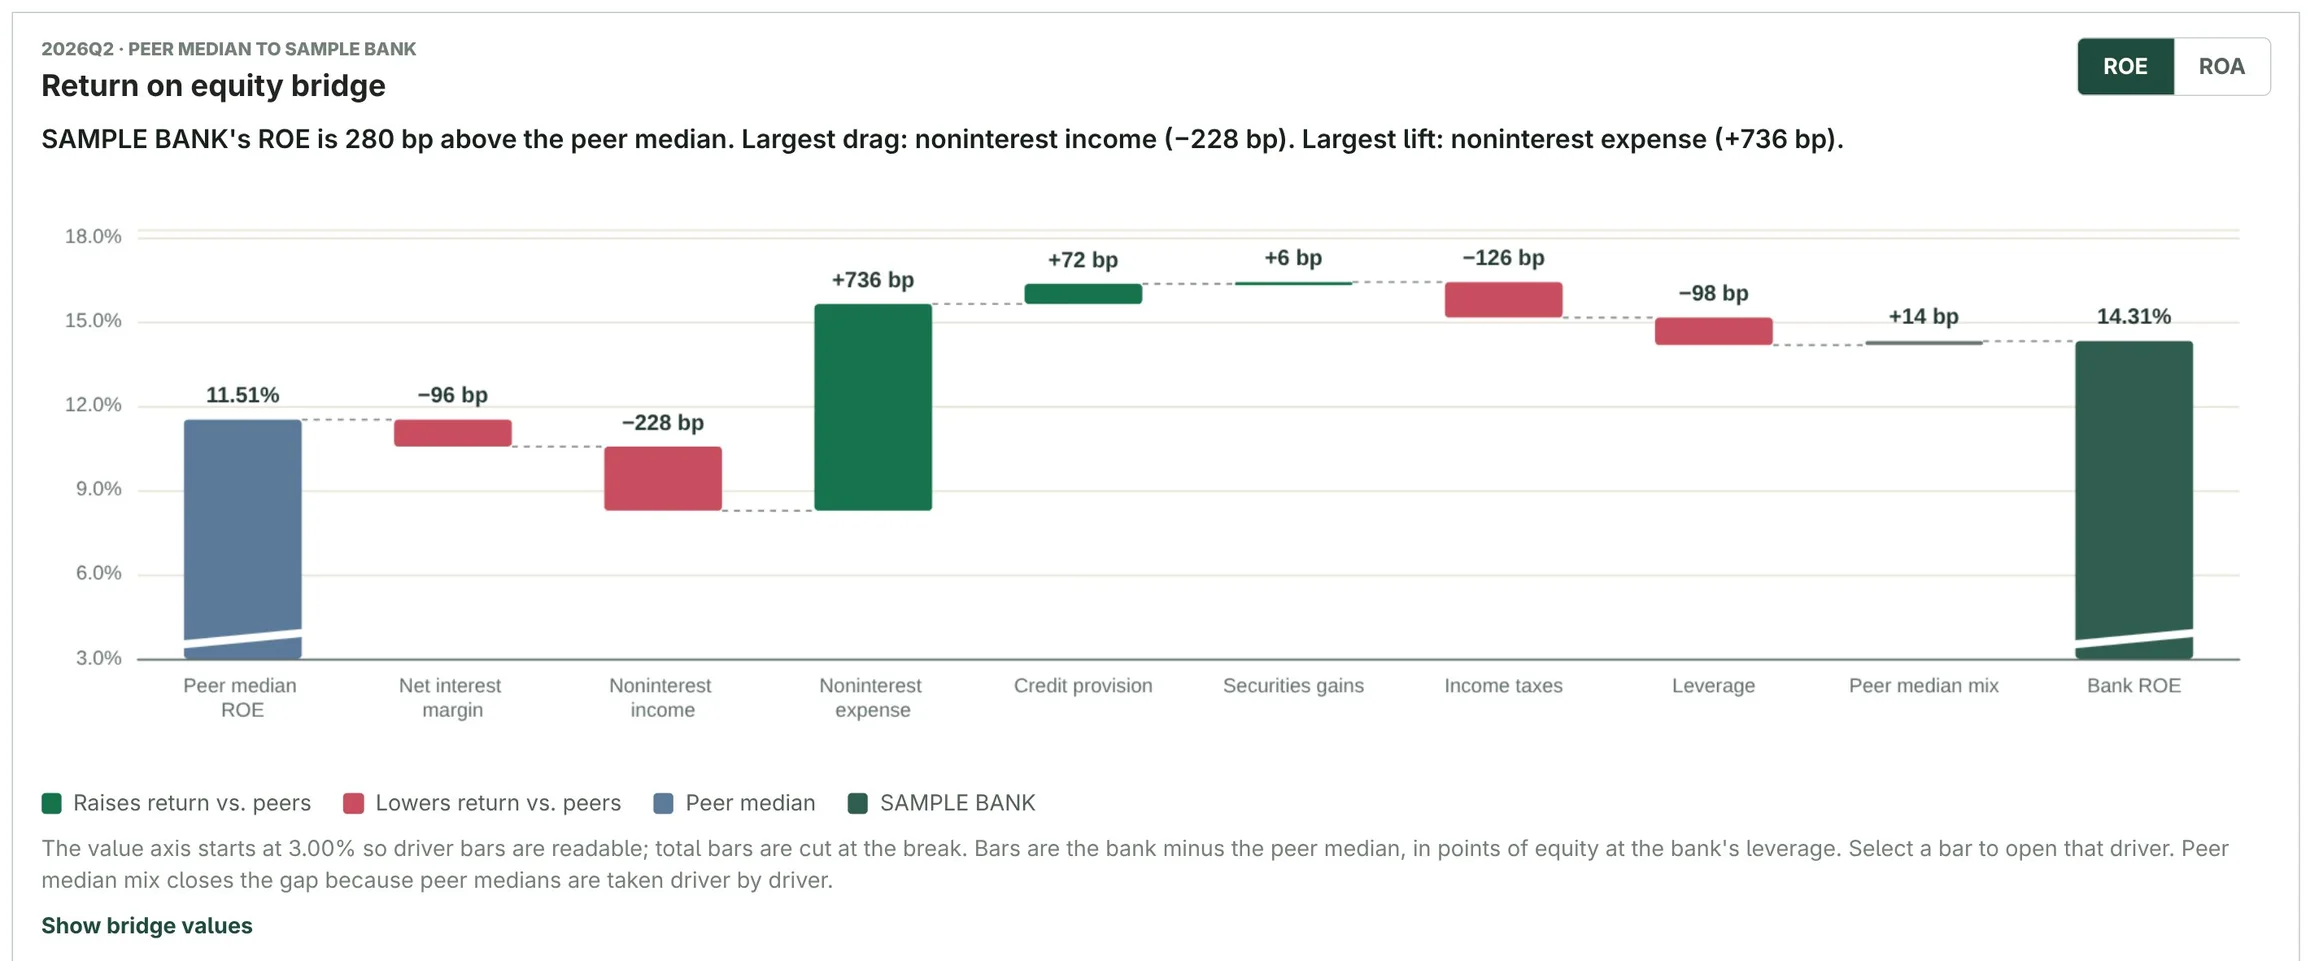
Return waterfalls, condition summaries, and ranked drivers explain the gap to peers in basis points, ready to export or present.
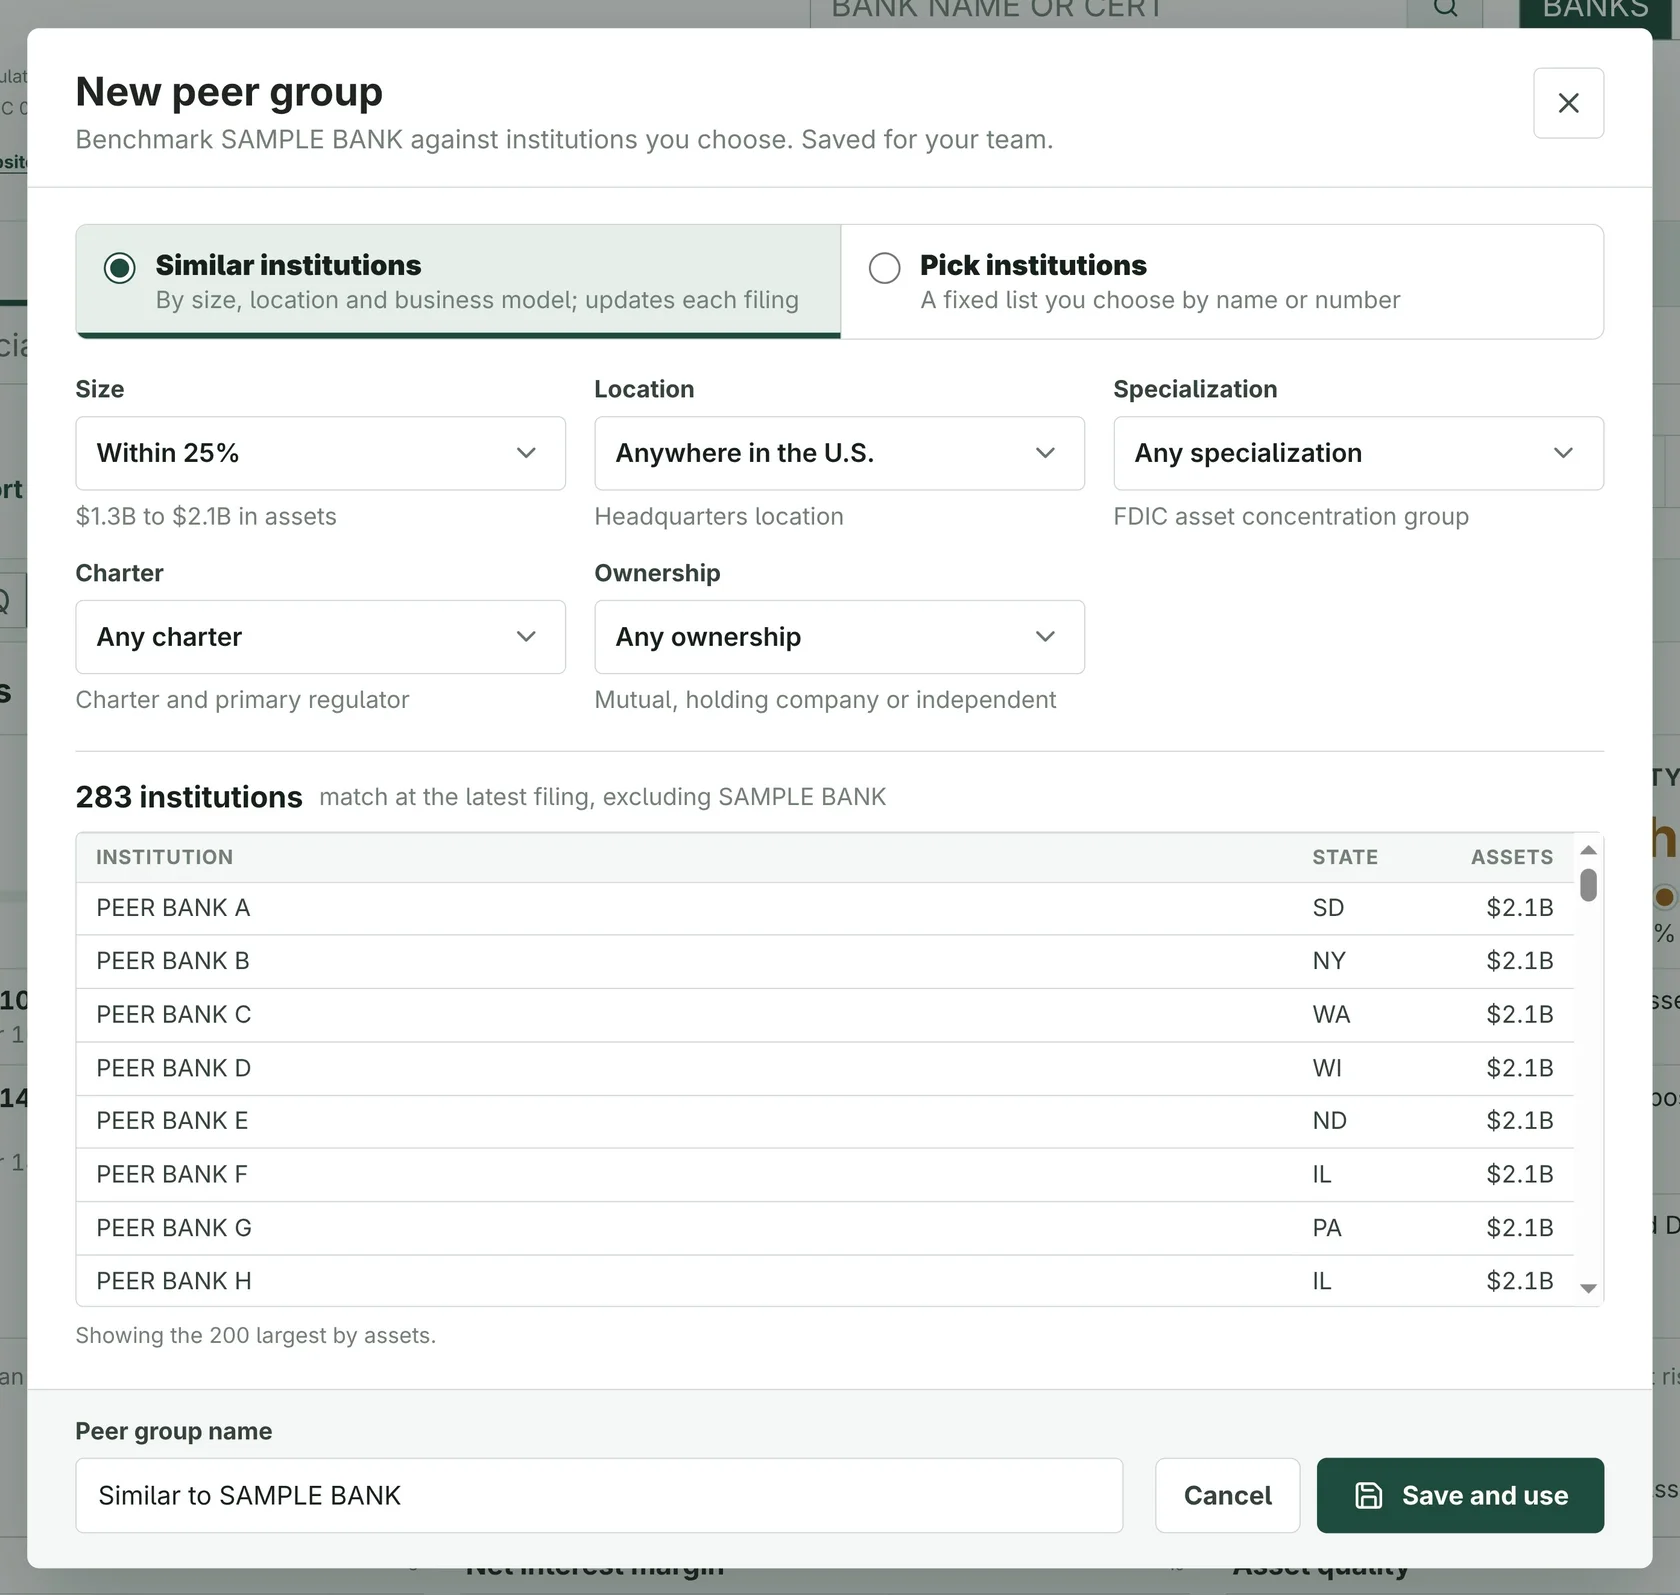
Peer groups
Start from the UBPR structure, a metro area, an FDIC region, or charter and ownership. Or build a group for your team: similar institutions that refresh every filing, or a hand-picked list.
Return waterfall
Walk from the peer median return to your own, one driver at a time: margin, fee income, expense, credit, taxes, and leverage. Click any bar to see what's behind it.
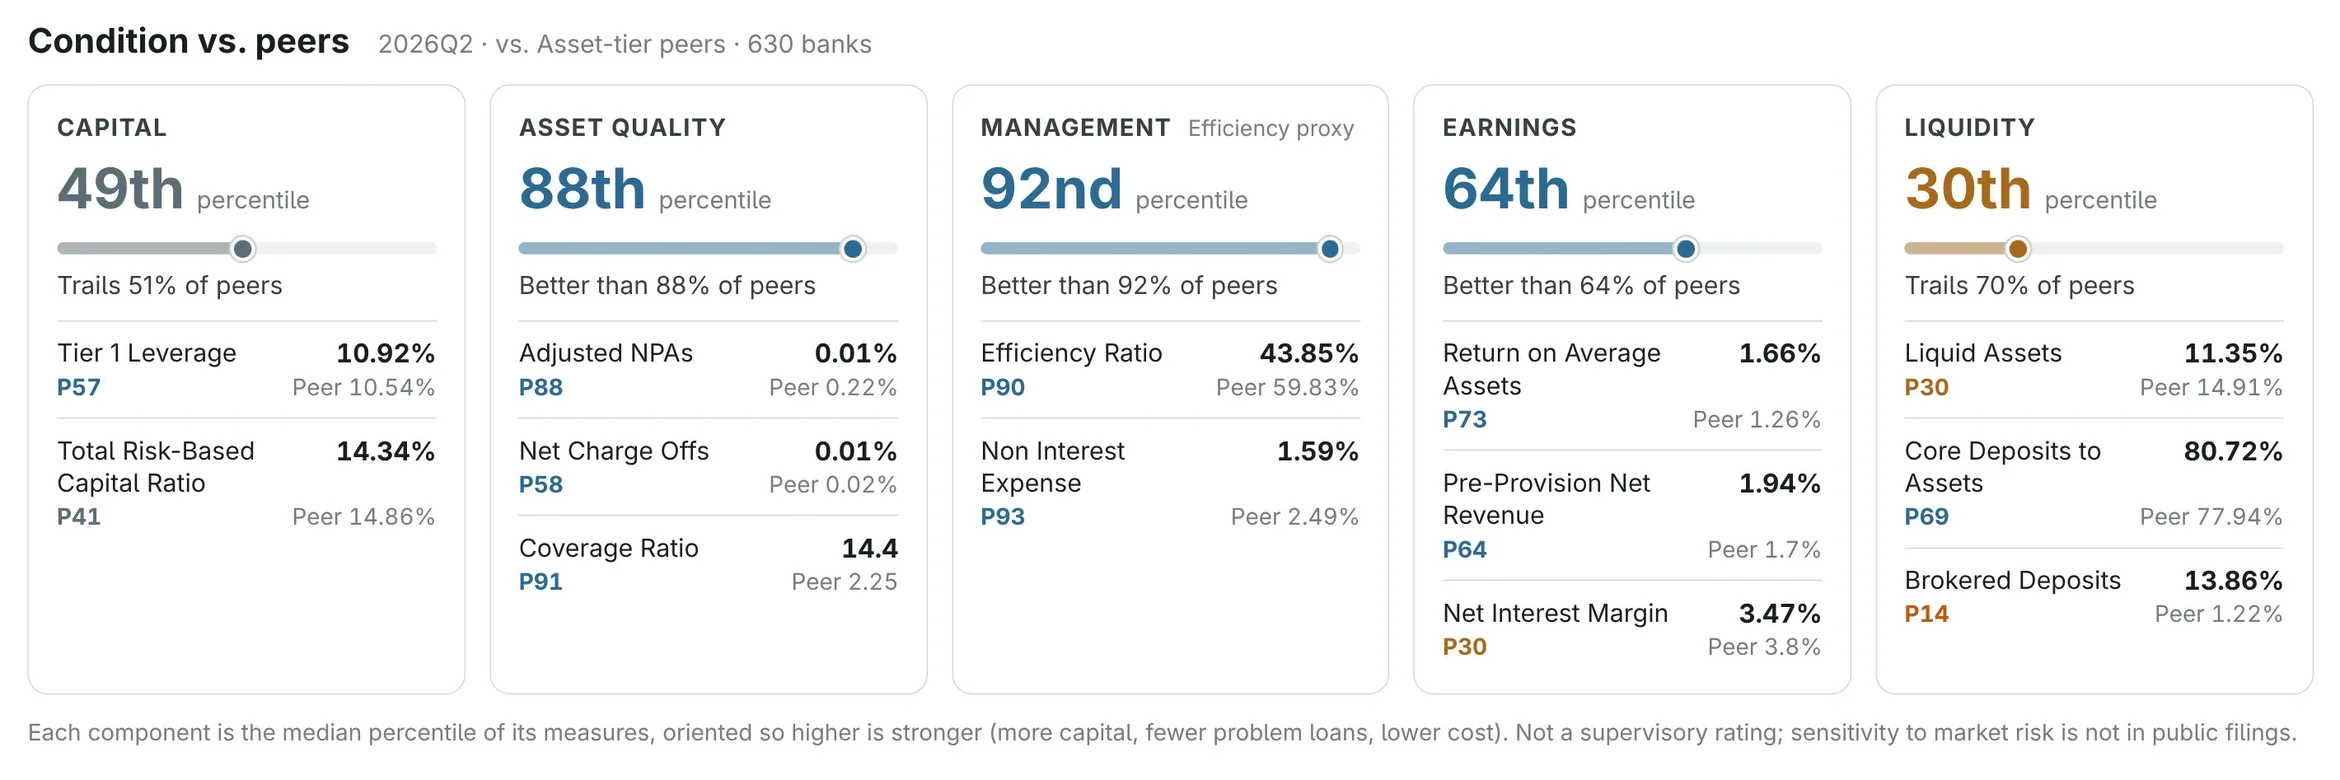
Condition vs. peers
Capital, asset quality, management, earnings, and liquidity, each scored as a peer percentile and oriented so higher means stronger. Every score opens the measures behind it.
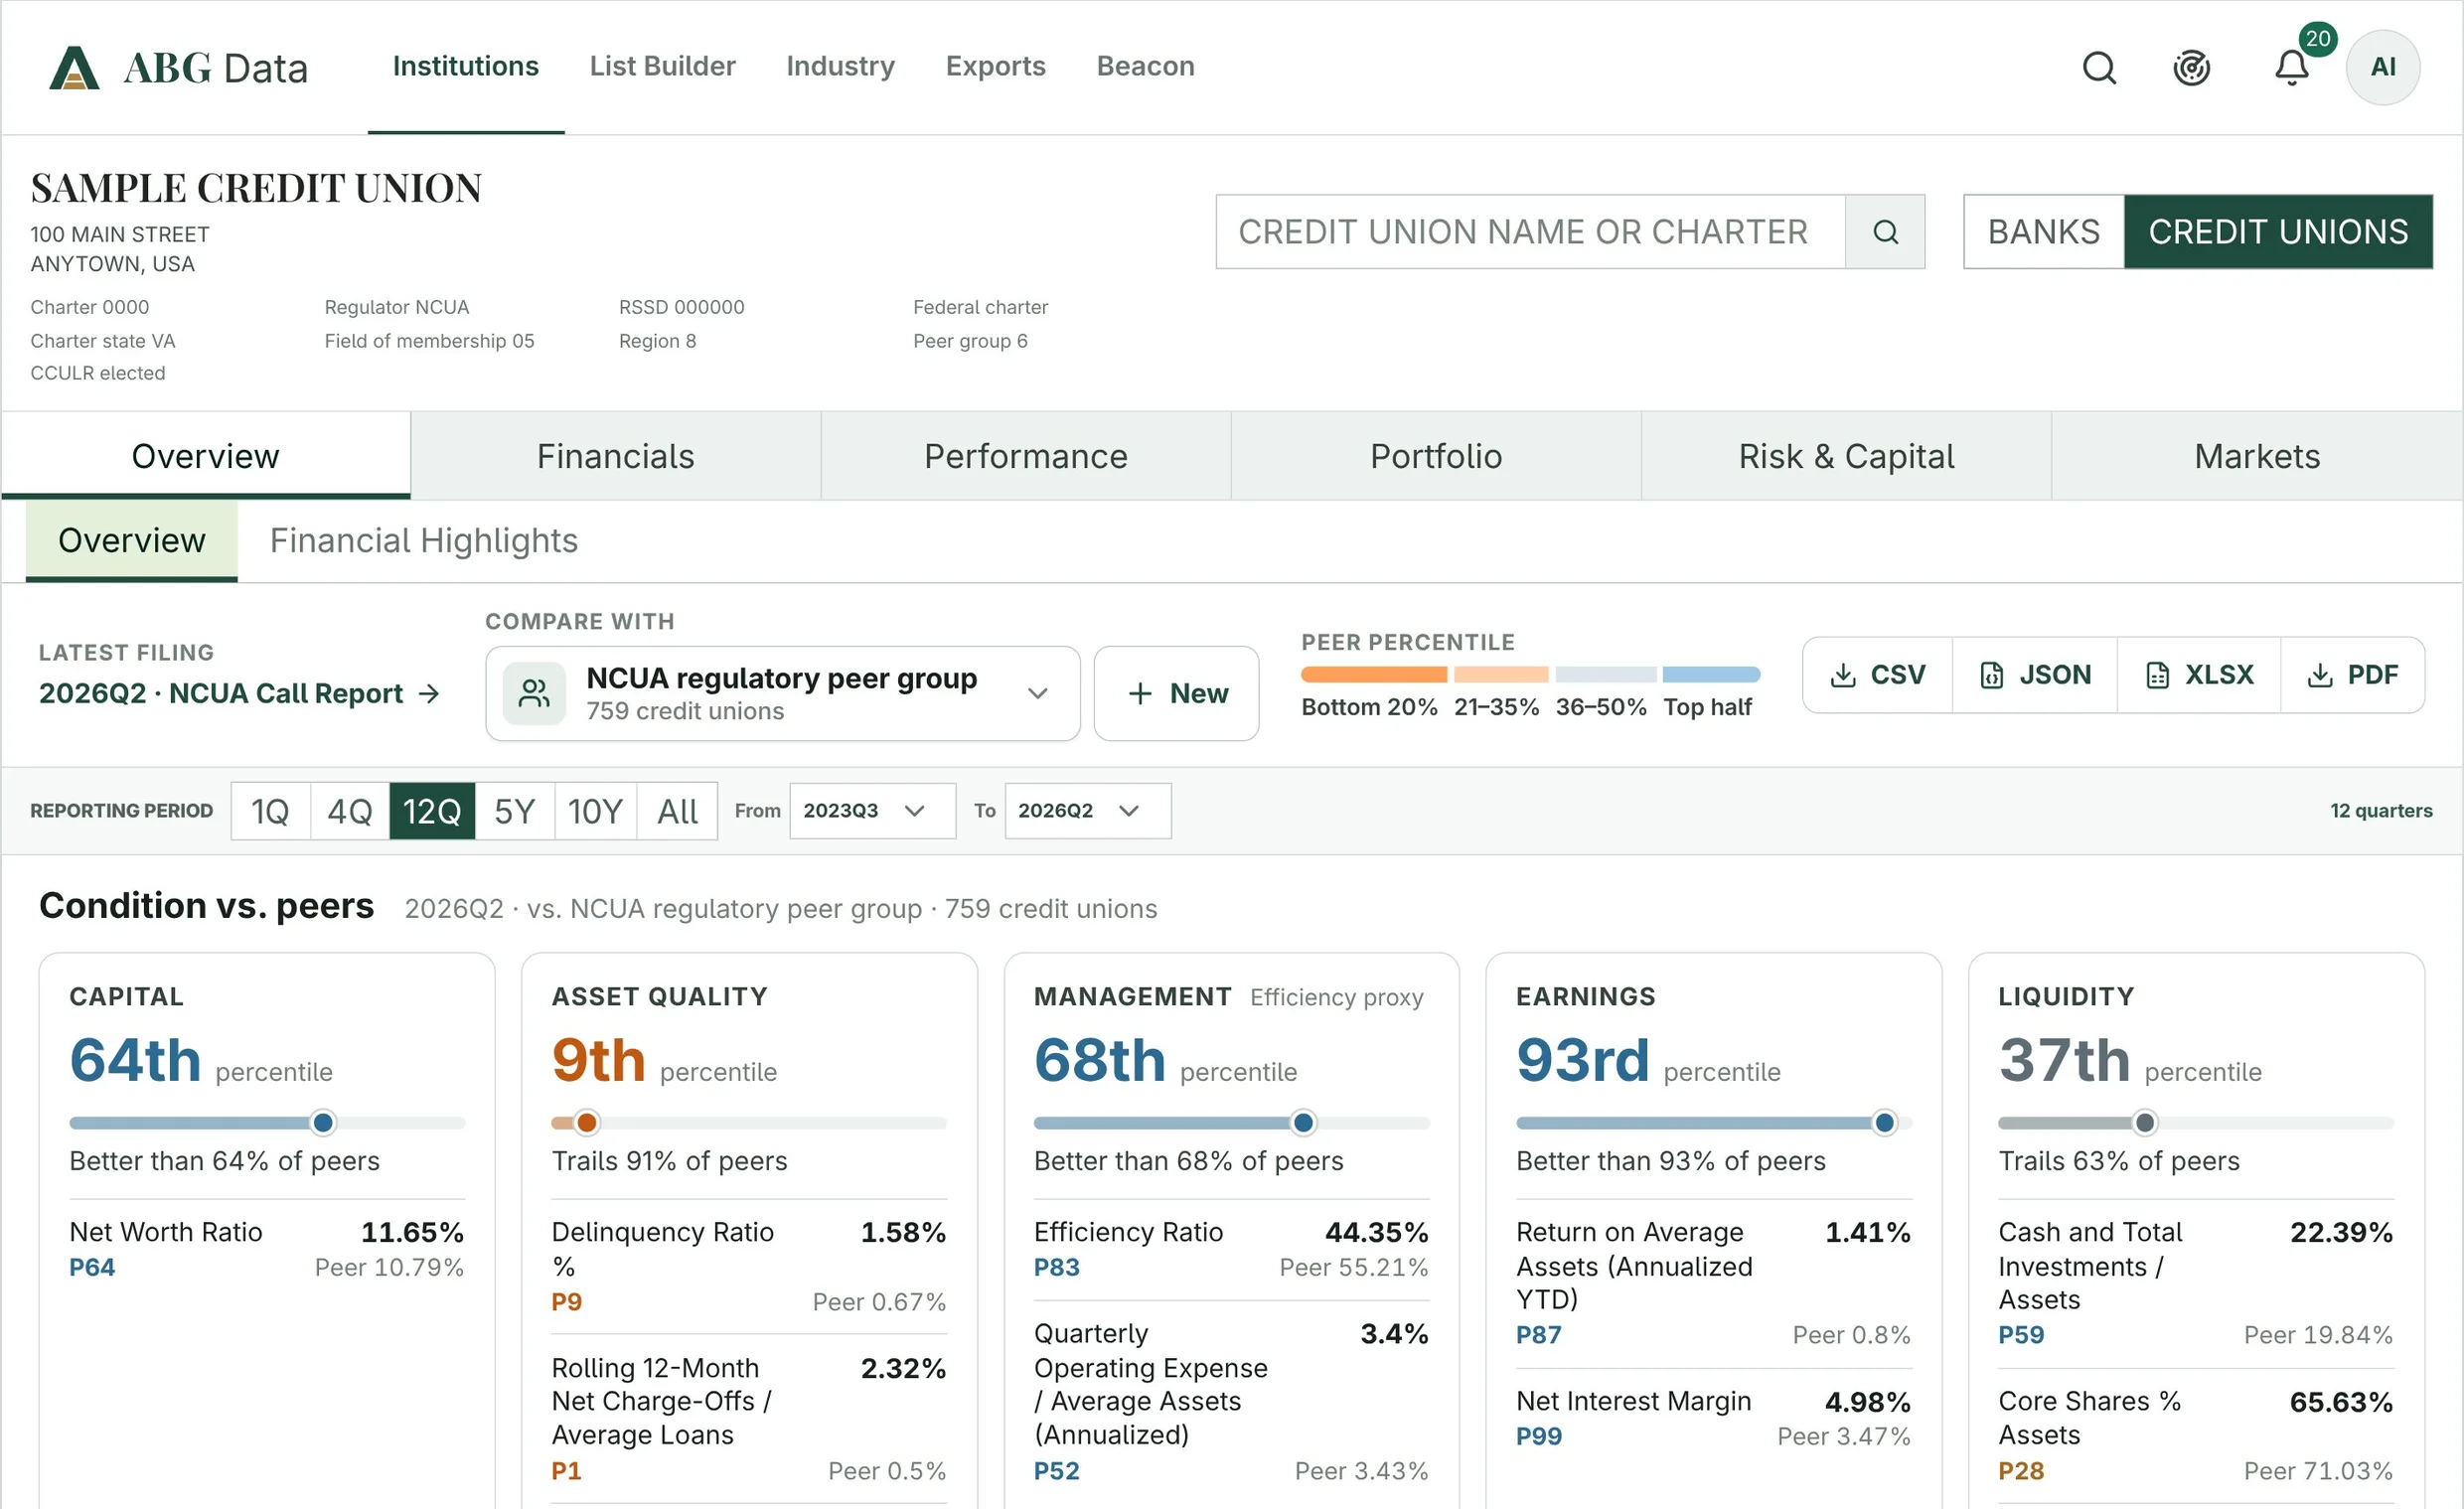
Credit unions
NCUA 5300 data back to 1994 with credit union peer groups by NCUA peer group, region, charter type, and low-income status, and an ROA waterfall built for credit union statements.
ABG Data in your AI assistant
Connect ABG Data to your AI assistant with your own login. It can find institutions, pull history, compare to peers, rank, and chart, using the same governed data as the app.
screen_institutions · compare_to_peers
Seven of 24 did. The top three by margin over the UBPR-style peer median:
Illustrative example.
The whole market
Institutions reporting in the latest quarter, by headquarters state. Hover a state for its count.
Texas · 352 banks · 380 credit unions
Every bank and credit union, every quarter, against the peers that matter to you.
FAQ
Public regulatory filings: FFIEC Call Reports and FDIC institution data for banks, and NCUA 5300 Call Reports for credit unions. We normalize them across form changes and reconcile them against the source.
New quarters load as the regulators publish them, and amended filings replace earlier values.
No. It is a peer-percentile view built from public filings. Supervisory ratings are confidential and use information that is not filed publicly.
Yes. Build them from similar institutions or pick members by name or certificate number. Groups are shared with your team and stay private to your organization.
Yes. ABG Data connects to Claude and ChatGPT through a secure connector that uses your own login and license.